Logo NoiseCapture Exploit NoiseCapture data


This page presents the 5 different ways to exploit data coming from the NoiseCapture app, listed below:

  1. Direct reading in the application
  2. Local .zip files on the smartphone
  3. Raw files stored on our server
  4. Formatted data via data.noise-planet.org
  5. Geoservices
These different levels, which give access to more or less information, call for varying user skills.

1. Direct reading


As described on the page here, you have three ways to visualize the measured sound levels in NoiseCapture:

1. Home page

Display the live sound levels, with 3 representation modes (spectrum, spectrogram or map).

Home page

2. Resulting page

Presents the physical indicators (average dB, time repartition, ...) resulting from the measurement.

Results

3. History page

List, visualize (opens the resulting page) and manage all the measurements already carried out.

History

Go to top

2. Local data


Through the history menu, you can also retrieve the data from the measurement.

Data retrival

In the History menu, select a measurement by pressing on it. In the menu that appears, select Export Result. From there, Android offers you to choose how to export the result (e.g. via email). In the .zip file you get, you will find the following 3 files:

  • meta.properties: measurement metadata,
  • README.txt: describing text,
  • track.geojson: the measure track.

Provided informations


The meta.properties file

Metadata file with the following information:

  • date and time of export
  • uuid: unique identifier of the NoiseCapture application (allows to attach the measurement to a smartphone and its features)
  • version_number: NoiseCapture version
  • method_calibration: calibration method (manual, reference value or automatic thanks to road traffic)
  • build_date: compilation date of NoiseCapture
  • device_manufacturer: smartphone brand
  • record_utc: utc measurement time
  • version_name: NoiseCapture release number
  • user_profile: indicates whether you have declared yourself as a novice or an expert
  • time_length: track duration (in seconds)
  • device_model: smartphone model
  • leq_mean: measure's mean LAeq in dB(A)
  • gain_calibration: gain used for smartphone calibration (in dB)
  • tags: list of the tag(s) associated with the measure (may be empty)
  • device_product: smartphone reference


The track.geojson file

Measurement information and acoustic indicator:

  • leq_mean: mean LAeq in dB(A)
  • marker_color: hexadecimal color used to display the point
  • accuracy: GPS accuracy
  • location_utc: GPS epoch time
  • leq_utc: measurement epoch time
  • leq_id: measurement id
  • leq_100, leq_125, leq_160, leq_200, leq_250, leq_315, leq_400, leq_500, leq_630, leq_800, leq_1000, leq_1250, leq_1600, leq_2000, leq_2500, leq_3150, leq_4000, leq_5000, leq_6300, leq_8000, leq_10000, leq_12500, leq_16000: LAeq values in dB(A) at the respective frequencies


Go to top

3- Raw files on our server


You can download the raw data available on the Noise-Planet server. You will get .geojson files.
To exploit these data in numbers, we propose you a "turnkey" tutorial, based on Python and R languages.

Requirements


To download and process the raw data, the user has to have installed:

Data recovery


Step 1: Get the filtered data

  1. Go to our Metabase dashboard : here
  2. Modify the parameters at will (1) in order to filter data (2)
  3. Download the complete list as a .csv file (small arrow at the bottom right of the screen) (3)
  4. Rename this file to query.csv

Metabase dashboard

Step 2: Download files (need python)

Metabase dashboard

  1. Download the download.py file here,
  2. Open this file in a text editor and replace the default query.csv file adress by yours (e.g "home/data_noisecapture/query.csv"),
  3. Execute download.py (e.g in a Linux terminal, just execute the command python3 download.py) → the filtered .zip files (in metabase) will be downloaded in the /data/ folder. In each of these .zip files (prefixed with track_), you will find the two meta.properties and track.geojson files described before.

Tip: filter your own data


You have the possibility to filter your own data, using your Unique User Identifier (UUID)

  1. In the NoiseCapture app, go to the "About" menu.
  2. Check and copy your ID (in this theorical example aabbccdd-d5d3-4c50-87aa-014593de95c9)
  3. In a web browser:
    1. Enter the following address https://data.noise-planet.org/raw/,
    2. Add your six first UUID caracters (in our example aa/bb/cc/),
    3. Add your UUID (in our example aabbccdd-d5d3-4c50-87aa-014593de95c9)
    4. The theorical resulting URI should be as follow: https://data.noise-planet.org/raw/aa/bb/cc/aabbccdd-d5d3-4c50-87aa-014593de95c9 (check a real example here).
  4. This way, only the measures made by this user are listed

UUID

Exploit the raw data


To illustrate this tutorial, we will use the RStudio application to run R scripts. There are many other similar applications that you can use in the same way.

Open files and compute indicators (need R)

  1. Download the indicators.r file here and open it in RStudio,
  2. Define your working directory in the menu Session / Set working directory / To source file location
  3. Adapt to your needs the input and output folders:
    • dir <- paste(getwd(),"/data/",sep="")
    • dirzip <- paste(getwd(),"/unzip/",sep="")
    • By default, the input data directory is set to /data/ and the resulting files will be placed in the /unzip/ folder.
  4. Run indicators.r. Depending on the spatial extent of your selected tracks, this process may take some time as the script will generate a regular grid over the entire study area.
  5. In the Viewer menu tab, the showed mapped is a copy of the map in Noise-Planet.org website, but now you can plot your own indicators!

RStudio user interface


Go to top

4. Formatted data


The measurements made by the community are collected, cleaned and then processed on our central database. From there, a daily export (every night) is made in order to generate .geojson files exploitable under open license (ODbL).

Data recovery


Noisecapture data

To obtain these data, simply go to the page https://data.noise-planet.org/noisecapture/ and choose the .zip file corresponding to the country of your choice.
Noisecapture data

Provided informations


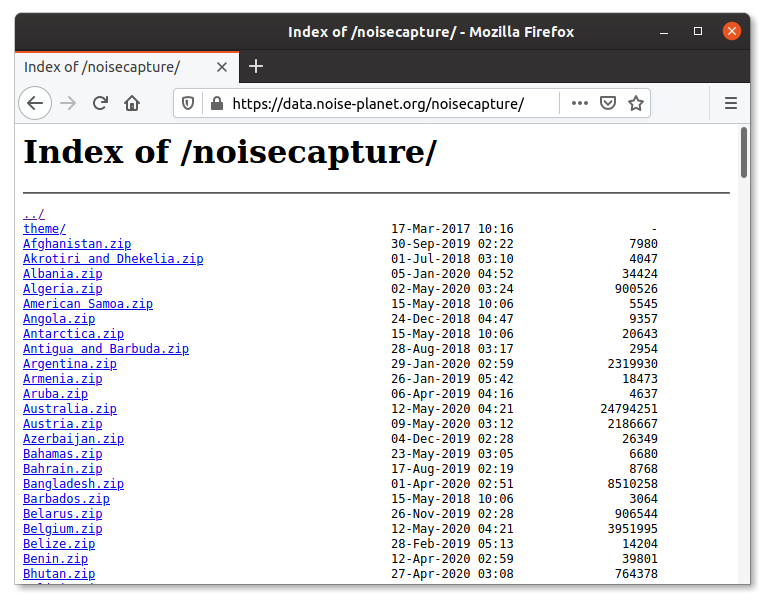
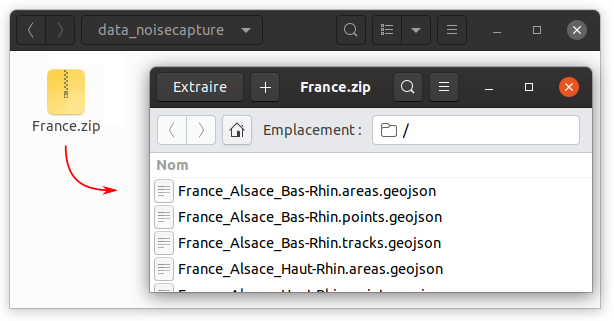
In each of the .zip files, 3 .geojson files per administrative region are provided: tracks, points and areas.
For more information, feel free to have a look to the following open article: Bocher et al. 2017, Collaborative noise data collected from smartphones, Data in Brief 14C (2017) pp. 498-503.

The *.tracks.geojson file

This file contains the data collecting along a GPS track. A GPS track is defined by 8 property values. Note that each feature of the GeoJSON is a measurement session over a time period (expressed in seconds). The geometry corresponds to the bounding box of measurements locations.

  • time_ISO8601: start time of measurement, using the ISO 8601 representation.
  • time_epoch: start time of measurement in Unix Time Stamp (UTS) format (number of milliseconds since January 1st, 1970, 00:00:00 GMT). The timezone is provided by the localization of the measure, not by the configuration of the smartphone.
  • pk_track: Database of track primary keys. This value may change when the zip files are updated, but are unique in the same zip file. This value is linked with the *.points.geojson file and could be used to build a geometry representation of the path of the measures.
  • track_uuid: Track Universally Unique Identifier. This unique value never changes between zip updates.
  • gain_calibration: Signal gain in dB, provided by the user after the noise calibration of the smartphone. Indeed, it is recommended to the user to proceed to an acoustic calibration of its smartphone, using the specific feature provided in the NoiseCapture application. This signal gain is already applied to all noise levels related to this track.
  • noise_level: Sound level LAeq in dB(A) along the track.
  • tags: User supplied tags for describing the noise environment along the track.
  • pleasantness: User supplied pleasantness 0–100 (may be null) of the noise environment along the track.

The *.areas.geojson file

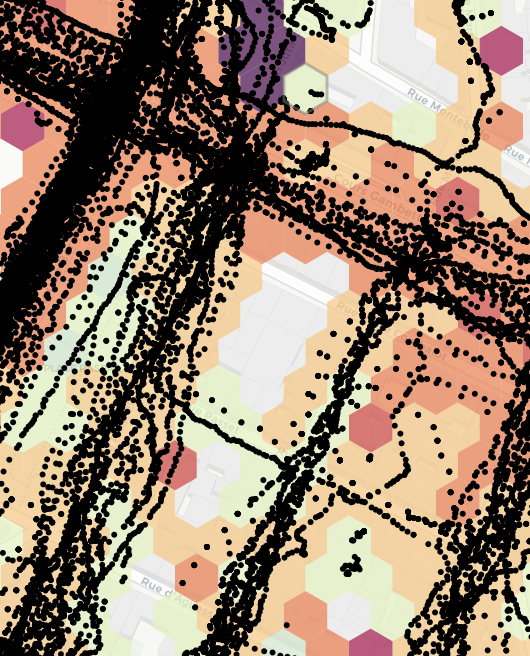
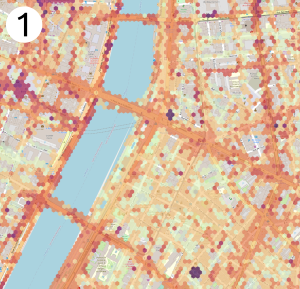
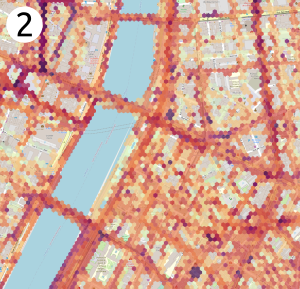
This file corresponds to a basic post-processing of all measurements produced by the community. All data are aggregated in hexagons, in order to produce mean noise indicators and information in each hexagon (mean LAeq, LA50, mean pleasantness) Each feature is an area represented by an hexagon of 15 m radius where all *.points.geojson have been aggregated.

  • cell_q: Hexagon q coordinate using EPSG:3857 -- WGS84 Web Mercator.
  • cell_r: Hexagon r coordinate using EPSG:3857 -- WGS84 Web Mercator
  • LA50: Median sound level in dB(A) (i.e. the noise level just exceeded for 50% of the measurement period)
  • laeq: Mean equivalent sound level LAeq in dB(A)
  • mean_pleasantness: Mean pleasantness 0–100 (may be null)
  • measure_count: Number of measurements (equivalent to the whole measurement time in seconds) in the hexagon (may be parts of different tracks)
  • first_measure_ISO_8601: Date of the first measurement in the hexagon, using ISO8601 time representation. The timezone is provided by the localisation of the measurement, not by the configuration of the smartphone
  • first_measure_epoch: Date of the first measurement in the hexagon, in UTS format
  • last_measure_ISO_8601: Date of the last measurement in the hexagon, using ISO8601 time representation. The timezone is provided by the localization of the measure, not the configuration of the smartphone
  • last_measure_epoch: Date of the last measurement in UTS.
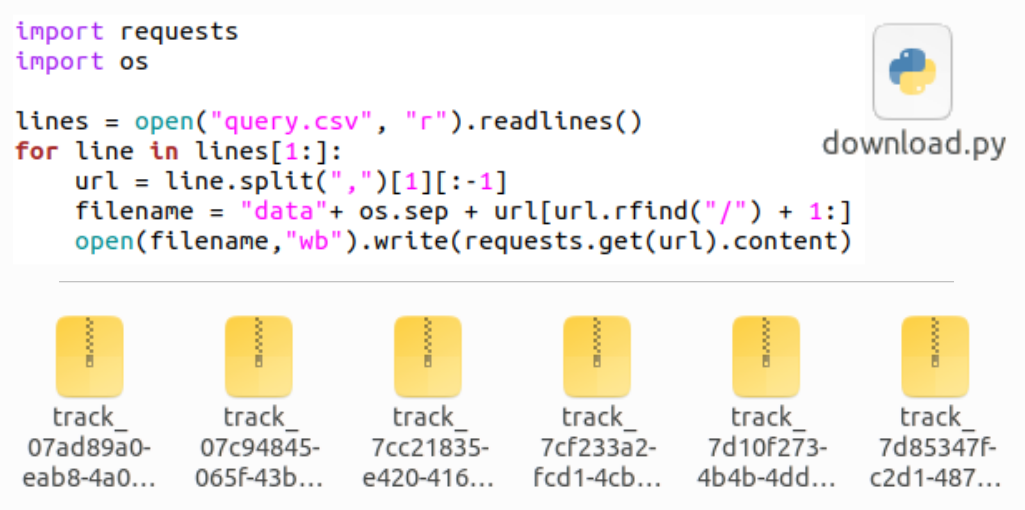
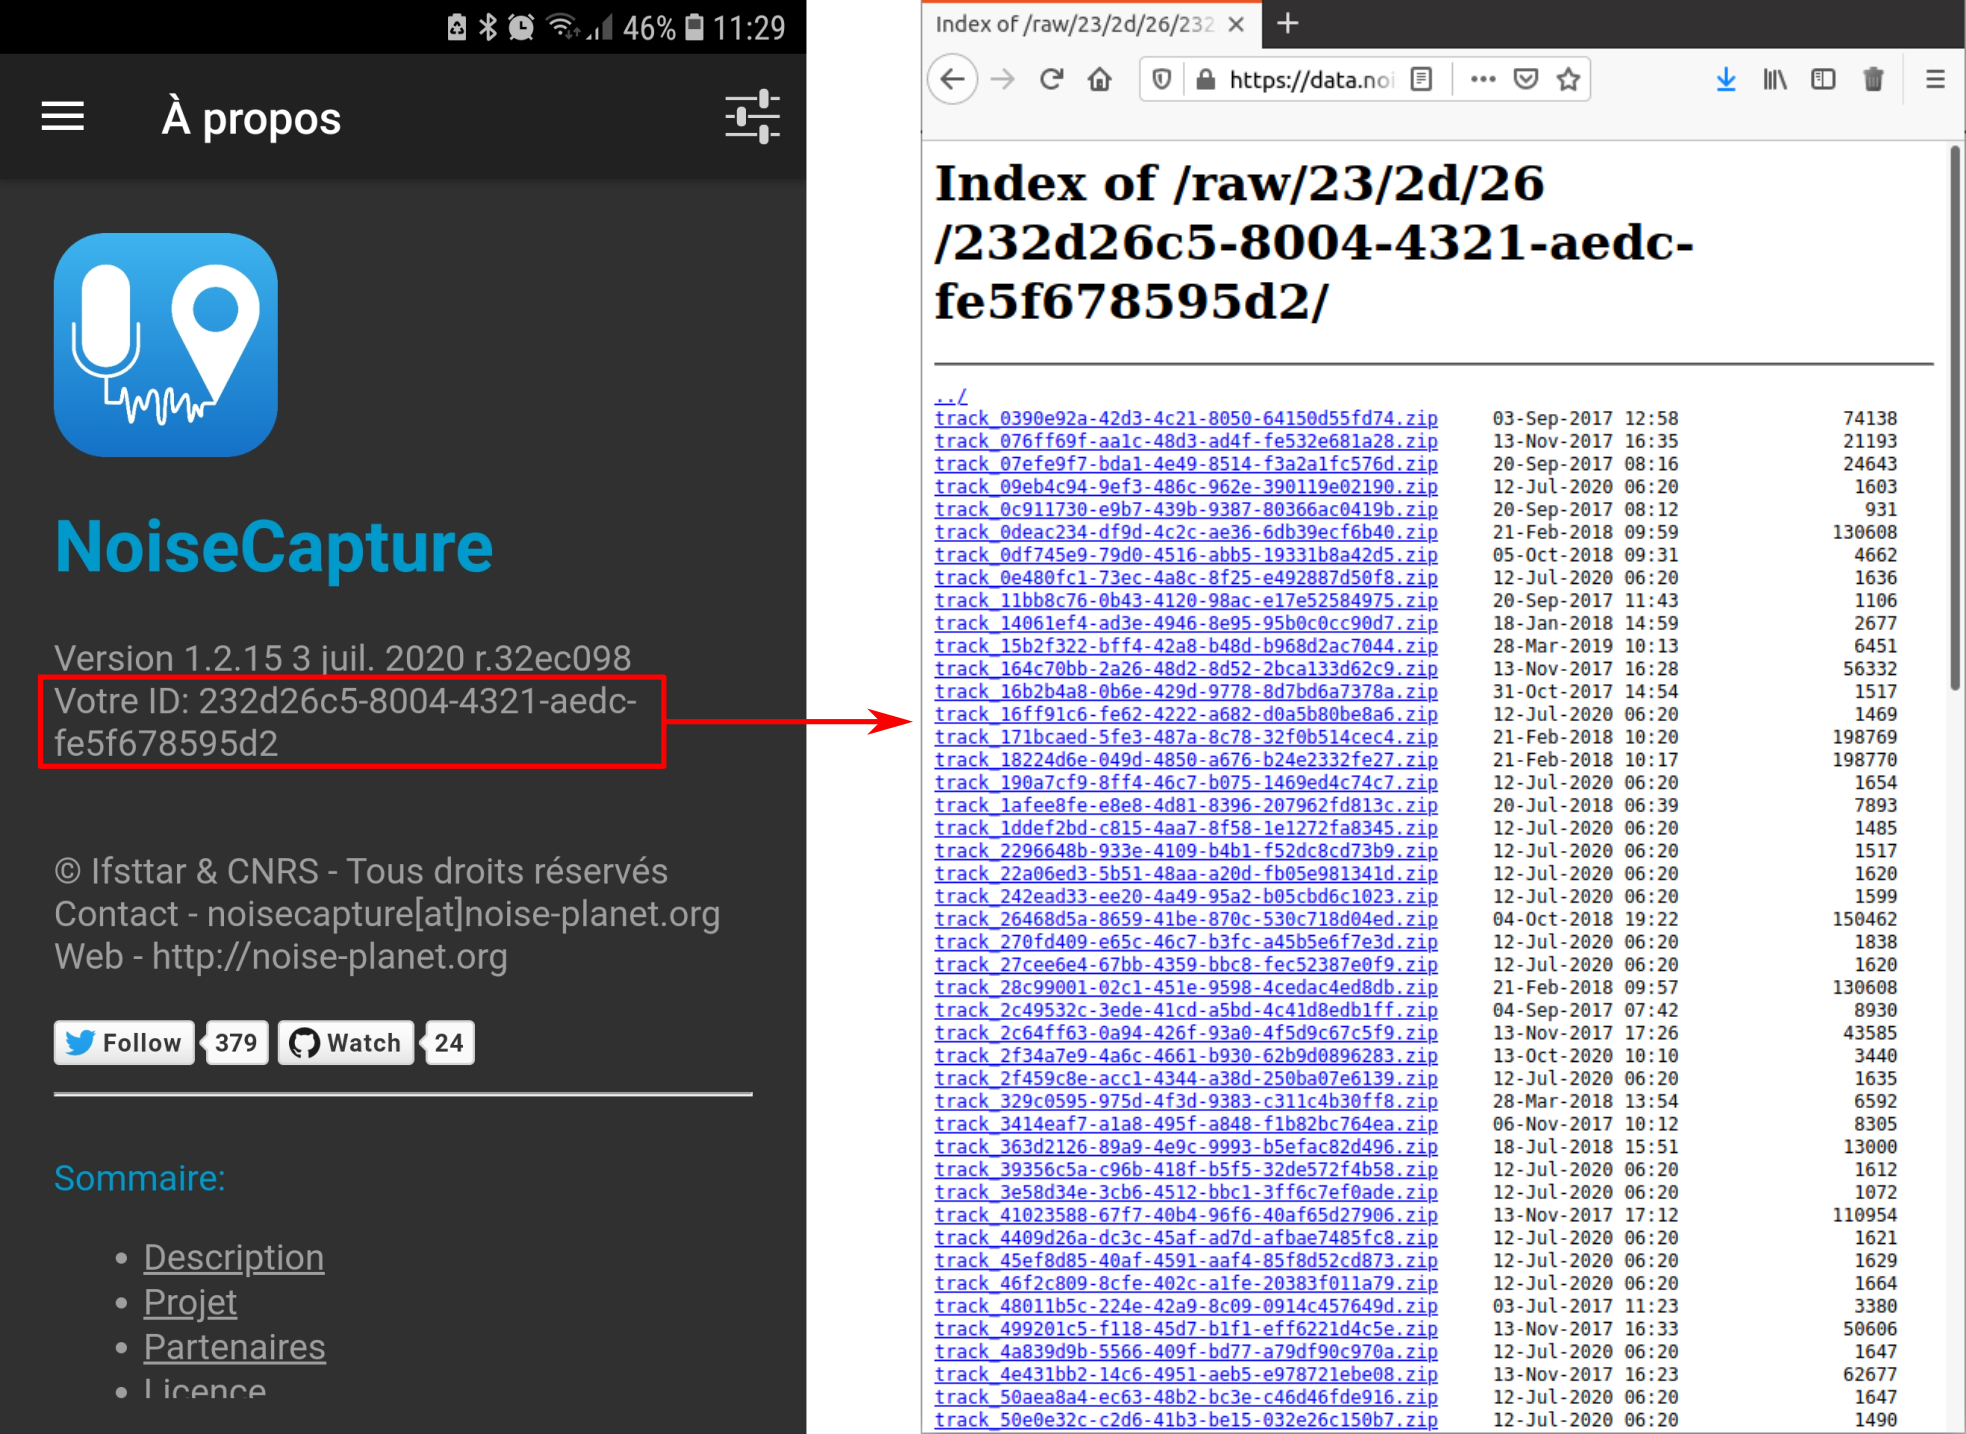
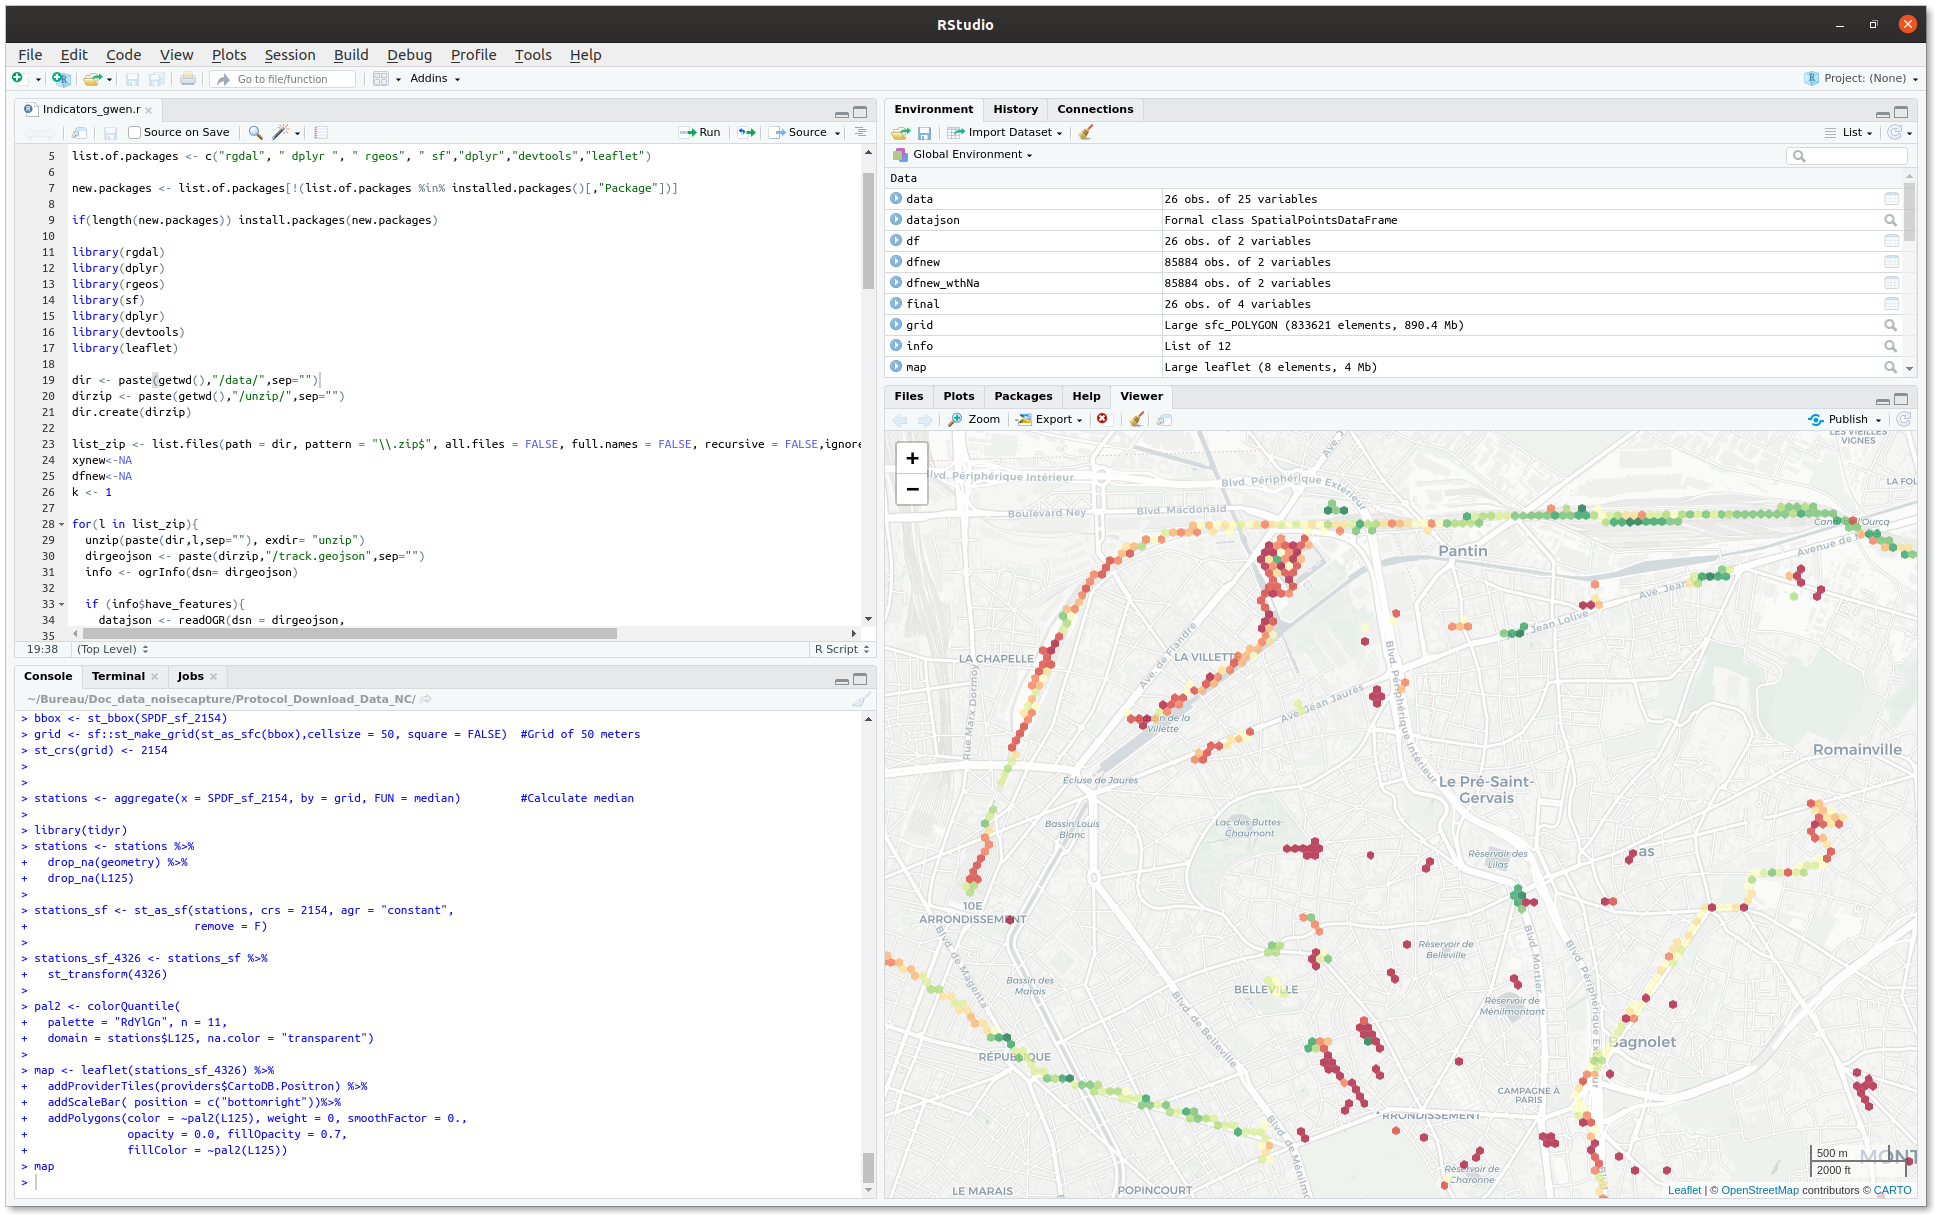
The *.points.geojson file

This file stores the measurement points. Each feature corresponds to a measurement at each second. The file contains a geometry field called the_geom and 9 property values.

  • the_geom: a point with X, Y and Z coordinates to store the GPS location.
  • pk_track: Track primary key. This value may change when the zip files are updated, but are unique in the same zip file. This value is linked with the *.tracks.geojson file and could be used to build a geometry representation of the path of the measures.
  • time_ISO8601: Time of the measurement using the ISO 8601 time representation.
  • time_epoch: Time of measurement in UTS format.
  • time_gps_ISO8601: GPS localisation may not be obtained each second, so the provided location is attached to the following "gps fix" time.
  • time_gps_epoch: "GPS fix" time in UTS format.
  • noise_level: Equivalent Noise level LAeq in dB(A), measured over a time period of 1 s.
  • speed: GPS provided speed (may be not accurate).
  • orientation: GPS provided orientation (may be not accurate)
  • accuracy: GPS localization accuracy in meters


Resulting files


Go to top

5. Geoservices


NoiseCapture data are collected, hosted, manipulated and distributed through the Onomap SDI, itself based on open tools, respecting OGC standards.
In this context, we are able to disseminate the data produced by the NoiseCapture community through 6 WMS layers, available at the following adress https://onomap-gs.noise-planet.org/geoserver/noisecapture/wms? and listed below:

User oriented layers

4 layers are users oriented:

  1. noisecapture:noisecapture_area: LA50 sound levels in dB(A) calculated within an hexagonal cells,
  2. noisecapture:noisecapture_area_laeq: LAeq in dB(A) sound levels calculated within an hexagonal cells,
  3. noisecapture:noisecapture_leaflet_point: all the measurement points made by the community (within a NoiseCapture party or not),
  4. noisecapture:noisecapture_points_party: measurement points made within a NoiseCapture party.

LA50 noise levels

LAeq noise levels

All measurement points

Party measurement points

Noise-Planet oriented layers

2 layers are rather dedicated to the Noise-Planet infrastructure since they meets technical needs:

  • noisecapture:noisecapture_area_cluster: meshing of the earth surface, in the form of a cluster with adaptive size according to the density of the measurements. This layer is used, among other things, to count the number of measuring points per zone,
  • noisecapture:noisecapture_area_party: LA50 sound levels in dB(A) calculated within an hexagonal mesh, for a dedicated party. To do so, this layer has to be used with a CQL filter based on the party code (e.g pk_party=2).

Warning, most of these layers are configured to be displayed below a certain scale. So if you are not viewing the data, you probably need to zoom in.

Go to top